
Scatterplot of Player Box Scores Playoffs 2020 Minutes vs Points
minutes in a single game vs points in a single game
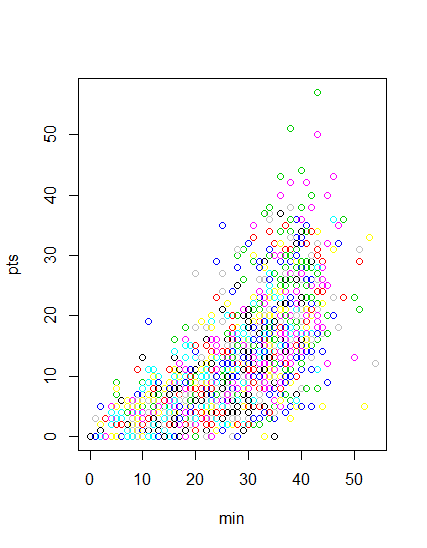
As minutes increase, so do points scored.
Each player is represented by a different color.
Histogram of Player Points Scored in a Game
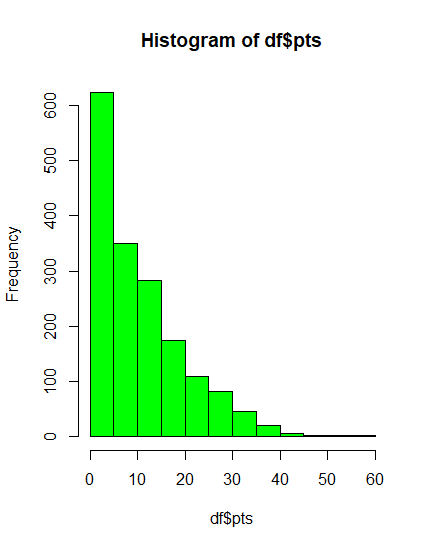
Many players scored few points in a single game and few players scored > 30 points in a single game
Histogram of Player Minutes Played in a Game
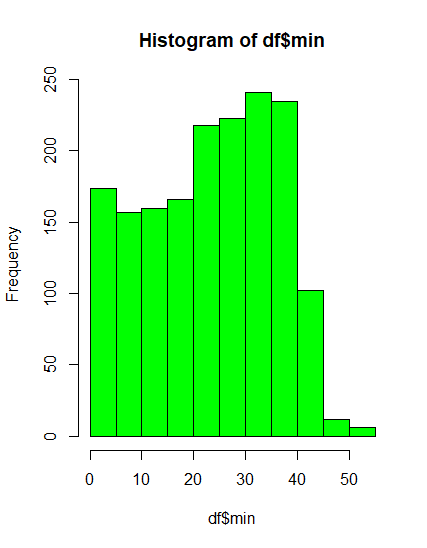
A handful of players played almost the whole game.
Most players played 20 to 40 minutes.
Boxplot of Minutes in a Game
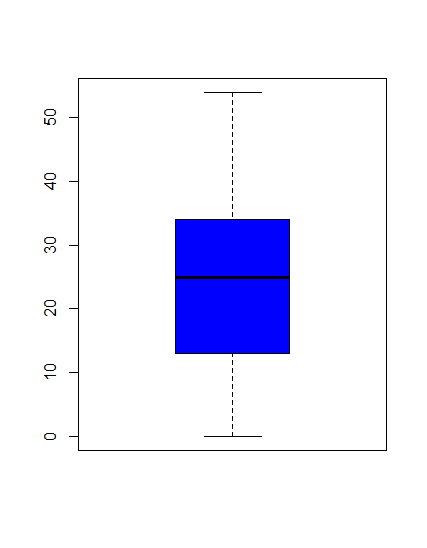
summary(df$min)
Min. 1st Qu. Median Mean 3rd Qu. Max.
0.00 13.00 25.00 23.72 34.00 54.00
Boxplot of Points Scored in a Game
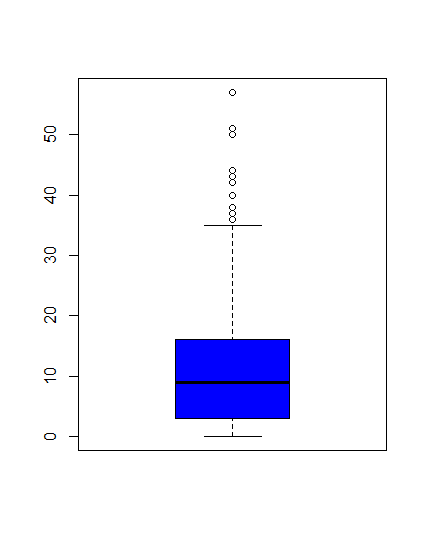
summary(df$pts)
Min. 1st Qu. Median Mean 3rd Qu. Max.
0.00 3.00 9.00 10.74 16.00 57.00