
Exploratory Data Analysis – Player Box Scores Playoffs 2020
Scatterplot of Player Box Scores Playoffs 2020 Minutes vs Points
minutes in a single game vs points in a single game
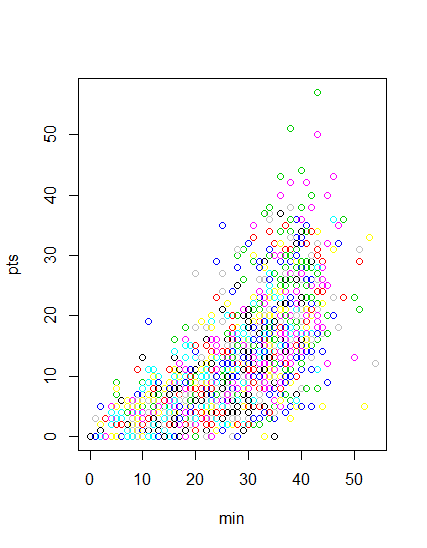
As minutes increase, so do points scored.
Each player is represented by a different color.
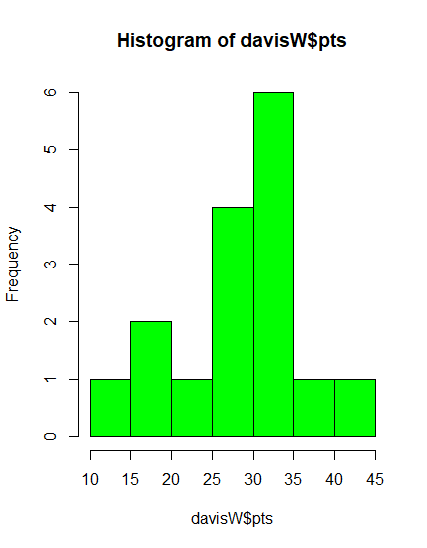
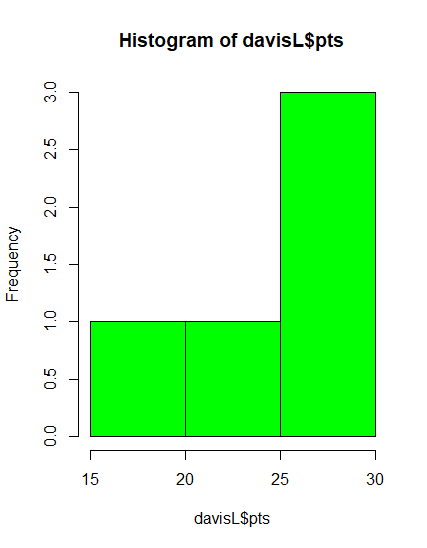
Histogram of Player Points Scored in a Game
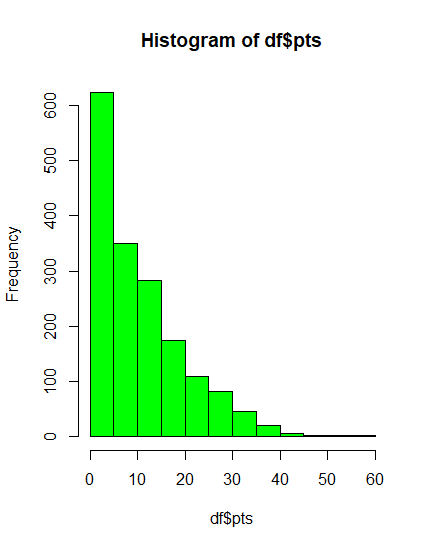
Many players scored few points in a single game and few players scored > 30 points in a single game
Histogram of Player Minutes Played in a Game
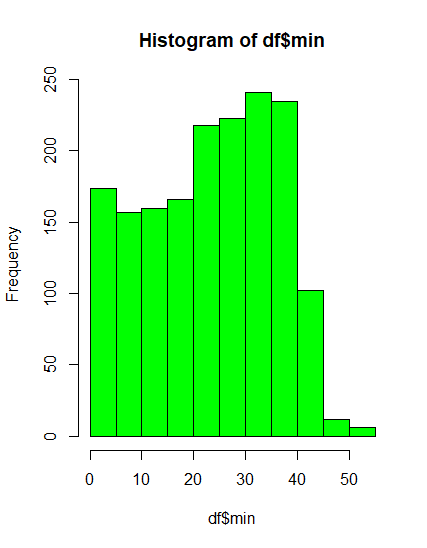
A handful of players played almost the whole game.
Most players played 20 to 40 minutes.
Boxplot of Minutes in a Game
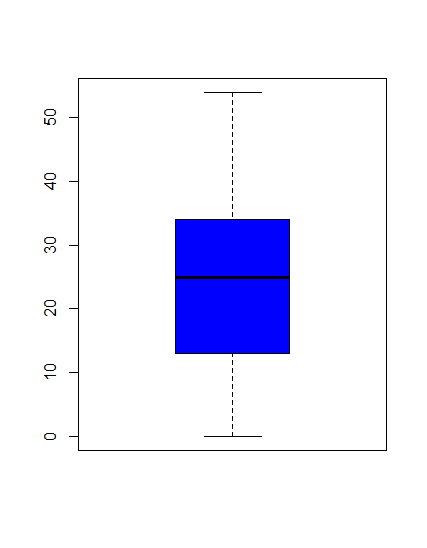
summary(df$min)
Min. 1st Qu. Median Mean 3rd Qu. Max.
0.00 13.00 25.00 23.72 34.00 54.00
Boxplot of Points Scored in a Game
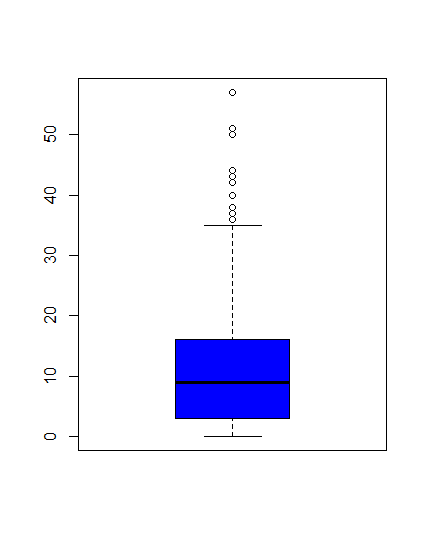
summary(df$pts)
Min. 1st Qu. Median Mean 3rd Qu. Max.
0.00 3.00 9.00 10.74 16.00 57.00
Data I’m Working With Now
NBATeamBoxScoresPlayoffsGlossary
Questions:
Does Home Court Advantage Matter?
Do starting players play more minutes in 2020 than in 2019?
dplyr
I’ve been looking at the dplyr package in R and going through the example exercises in the book. I’ve used python for data analysis up to this point so I’m learning how to do the same things in R with this course’s recommended book. Not sure yet what I like better. Its mostly a process of learning the syntax of R and the functions of dplyr. Ive used ggplot2 in R for plotting and other visualizations before. I guess I can use either python or R, doesn’t really matter. Ill try R for now using the Exporatory Data Analysis with R. I’m going to be thinking of how I can best report and share interesting findings from my data that is more important than the tool used to get there.
Getting Started
I searched the internet for NBA data. There is a huge dataset with past years data but I wanted current data. The NBA has a good webpage stats tool where you can select filters and find anything you want for stats but there is no files available for download from there. I figured out that I can use their stats tool to search for whatever I want and then copy and paste the results to a text document and save that. Then I can upload that in R to analyze. There was a problem with the spacing in the data because the columns were separated by tabs instead of commas or just one space but I figured out I can specify that the separator is \t which is what the code is for a tab. I will gather data in this way. There are several questions that I can ask of the dataset and I’m sure there will be more as I continue researching.
1st post
This is my first post, I’m trying to figure the blog out, how to edit posts , how to make posts, who can see the post, ect.
I’m hoping to do my research project on the changes in the NBA during the pandemic. I’m thinking something interesting would be to look at home court advantage before the pandemic and during the pandemic to see how home court advantage affects the outcome of games, probably more during the playoffs.
Hello world!
Welcome to UMassD WordPress. This is your first post. Edit or delete it, then start blogging!